
Why 48V DC Power Shelves Trip When Nothing Is Actually Wrong
A nuisance trip happens when a breaker or other protective device opens with no fault in the circuit. The hardware is fine, the load is where it should be, and the breaker still opens. Nothing failed, but the outage is real.
A real fault looks different. Something draws too much current, shorts, or breaks down its insulation, and that either damages equipment or creates a hazard. Fixing it means repairing or replacing the failed part.
On 48V DC power shelves, these trips are not random. They follow a pattern set by how modern IT and telecom loads draw power at startup. Naming the parts precisely makes the pattern easier to see.
Three terms come up in almost every investigation. Inrush current is the brief, high current a load draws as its input capacitors charge at energization. Breaker coordination is how upstream and downstream breakers are selected and set so they trip in the right order. The breaker trip curve describes how fast a breaker responds at a given current.
These three interact. Inrush current can look exactly like a fault on an aggressive trip curve. Poor coordination lets a single shelf energize into upstream protection that senses the summed current of everything downstream. Either way you get an outage with no obvious cause.
Unresolved nuisance trips come from a chain of three things: inrush current, breaker coordination, and the order in which you fix them. Address one and the problem usually moves instead of disappearing.
The sections below take each factor in turn, show how they combine into false trips, and give the order that actually clears 48V DC power shelf nuisance trips.
How Inrush Current Creates False Faults
When a DC power shelf energizes, the source does not see a load first. It sees a discharged bank of bulk capacitors. A capacitor’s voltage cannot change instantly, so at the moment of switch-on it looks almost like a short and presents a very low initial impedance to the supply. The result is a brief but steep inrush current (commonly called capacitive inrush) that flows only until those capacitors reach their operating voltage and steady-state operation begins.
The shape of that spike follows the circuit. Its magnitude is the source voltage divided by the total series resistance in the loop: the capacitors’ equivalent series resistance (ESR), wiring and connector resistance, and any deliberate limiting device. Its duration follows the RC time constant of the same loop, so lower ESR and shorter cabling both produce a higher, faster pulse. Long harness runs and loose terminals add resistance and stretch the event out; tight, low-resistance paths concentrate it into a sharper peak.
How many modules energize at once matters just as much. Bringing up a single module draws one inrush event. Energizing a whole shelf at once superimposes several capacitor-charging events, so the peak at the upstream breaker or feeder can be several times larger than any single module’s rating. Protection curves often misread that aggregate current, and that is how a healthy shelf trips a breaker that never saw a fault.
Current-limiting elements push back. An NTC thermistor adds resistance while cold, suppressing the initial spike, then self-heats and lowers its resistance so it does not waste power in steady state. Active soft-start circuits ramp the input voltage or gate the current more precisely, trading a little complexity for repeatable, predictable behavior at every startup.
Repeated restarts and slot-by-slot bring-up change the inrush profile in two ways. A hot NTC thermistor no longer presents its high cold resistance, so back-to-back restarts can produce progressively larger spikes – the opposite of the intended effect. Staggering module insertion lowers each individual peak but multiplies the number of events, giving the breaker more chances to accumulate heat. Being able to tell capacitive inrush, loop resistance, and startup sequencing apart is the first step toward separating a real fault from an inrush current event that merely looks like one.
Before you touch a single setting, it helps to map the failure modes against what you can actually observe. For teams responsible for uptime across high-utilization sites, the table below pairs each root cause with what it physically does, how it presents, and how to confirm it fast, the same diagnostic discipline used in fleet maintenance operations.
Nuisance Trip Root Cause Comparison
| Root Cause | Physical Mechanism | Typical Symptom | Where It Shows Up | Quick Detection Method |
|---|---|---|---|---|
| Capacitive inrush | Bulk input capacitors draw a high dI/dt current spike before steady state; peak limited only by ESR and loop impedance | Instantaneous trip on energization, then resets on a second attempt | Rectifier/module input, DC shelf feed, bulk capacitor bank | Current probe plus oscilloscope on the DC feed; compare peak I to breaker instantaneous trip threshold |
| Breaker/fuse mis-coordination | Upstream magnetic trip or fuse I2t curve sits below the module inrush envelope | Upstream device opens before the module’s own protection acts | Cascaded devices: panel feeder versus branch breaker | Overlay time-current curves (TCC) of both devices against the measured inrush waveform |
| Temperature-driven breaker derating | Thermal-magnetic element trips earlier as ambient rises; the bimetal reference point shifts | Trips only during hot afternoons or peak cabinet load, never on cold starts | Breaker inside a hot cabinet, near heat-generating modules | Log ambient at the breaker; compare trip current at 25C versus the datasheet curve at 50C |
| Loose or high-resistance terminations | Rising contact resistance causes localized heating and voltage sag under load | Intermittent trips, discolored lugs, warm terminal blocks | Lug/terminal connections, busbar joints, module backplane | Thermal camera scan; micro-ohm or millivolt-drop measurement across the joint |
| Cumulative module restart surges | Many modules re-energizing together stack concurrent inrush into one composite surge | Trips after a disturbance when multiple modules recover at once | Full shelf during restart following a sag or outage | Capture total shelf current on restart; check for simultaneous module turn-on |
The diagnosis steps and fix-order decisions later in this guide all point back to these five rows.
Breaker Coordination: Matching Trip Curves to Real Current
Breaker coordination is the practice of selecting, rating, and setting protective devices so that the device nearest a fault clears it first while every device upstream stays closed. In a 48-volt direct current (DC) distribution hierarchy, coordination decides whether one failing load trips a single branch or takes down the whole shelf.
Thermal and Magnetic Trip Elements
Most low-voltage breakers are thermal-magnetic. The thermal element is a bimetal strip that bends as current heats it, an inverse time-delayed response: small overloads take minutes, larger ones take seconds. The magnetic element is an electromagnet that trips almost immediately, typically under 20 milliseconds, once current crosses a set multiple of the breaker rating. That rapid action is the instantaneous trip.
The two elements cover two different failure modes. The thermal element protects conductors from sustained overload. The magnetic element protects equipment from short-circuit currents.
Reading a Time-Current Curve
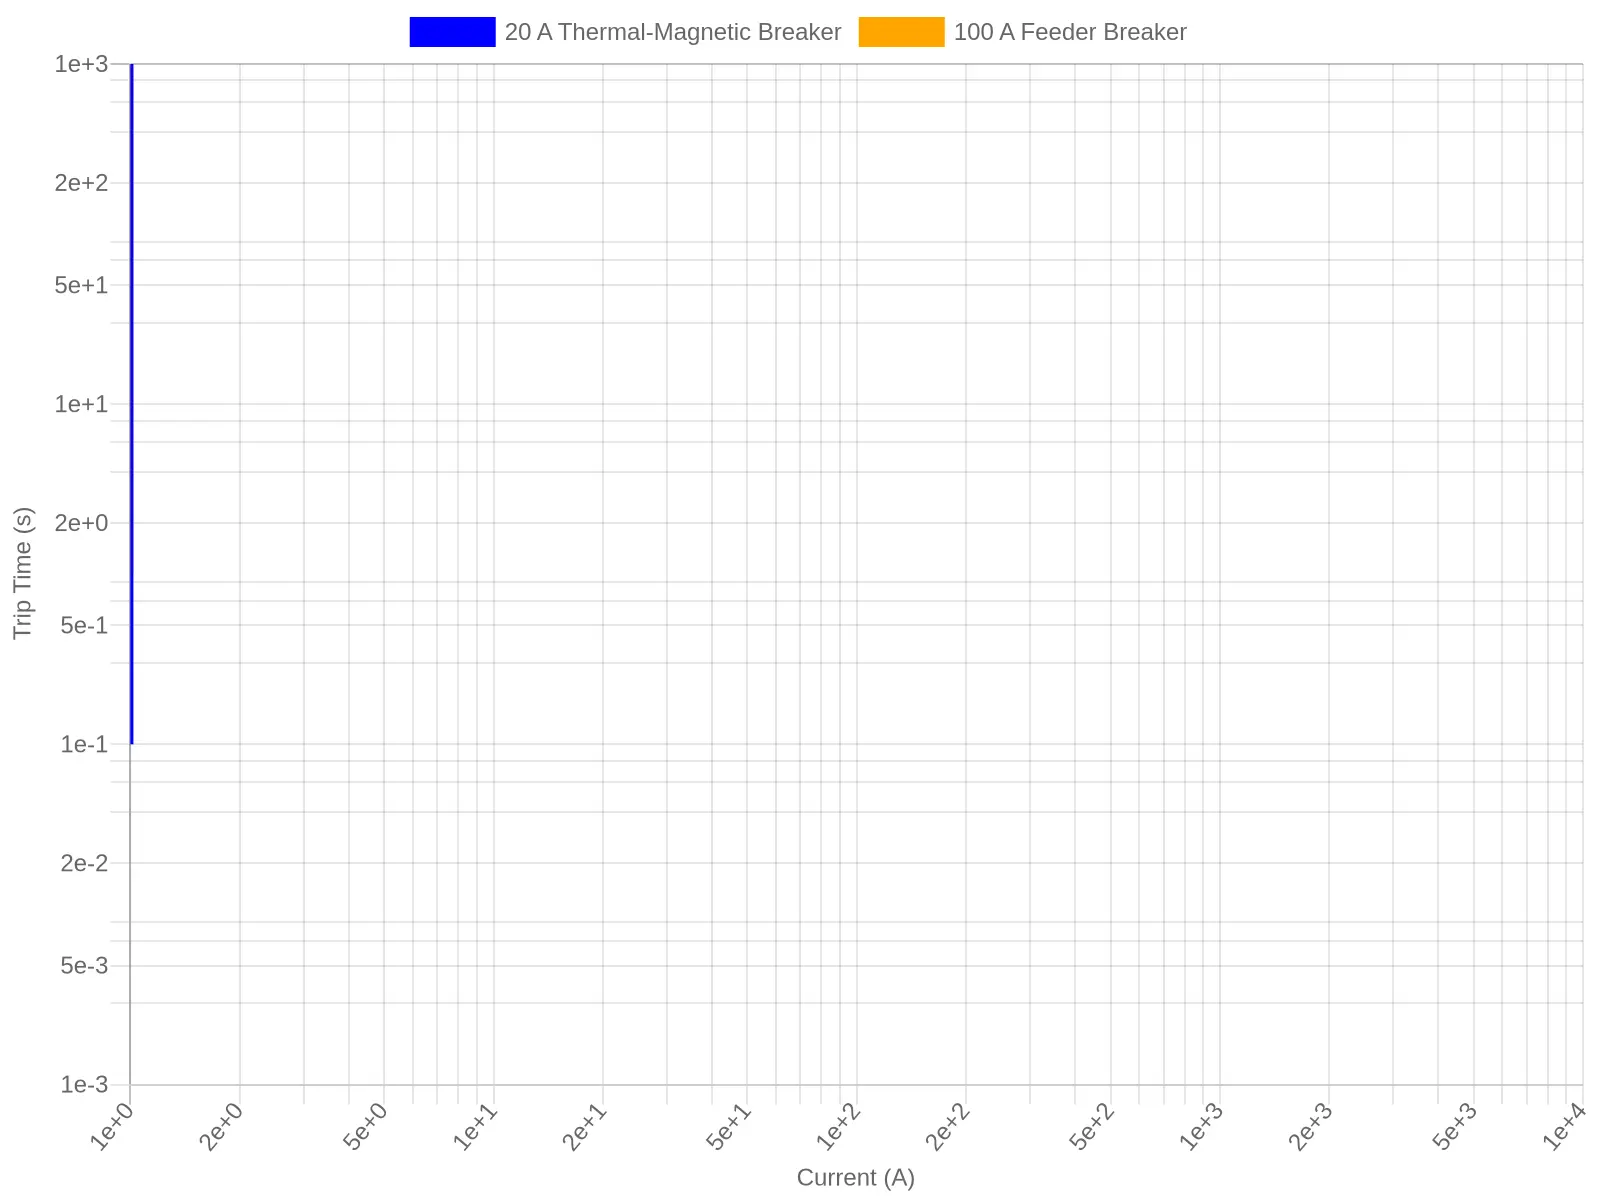
A time-current curve (TCC) is a log-log plot of trip time against current. The thermal band slopes downward; the magnetic element appears as a near-vertical line at the instantaneous threshold. To predict what a breaker will do at a given current for a given duration, the TCC is the most reliable tool you have.
Why Inrush Duration Matters
Power shelves present a capacitor-charging transient at startup. Inrush can reach several times the steady-state rating for 5 to 50 milliseconds. The magnetic threshold must sit above the inrush peak, and the thermal element’s I²t characteristic must absorb that pulse without accumulating enough heat to open. The principle is straightforward: let the startup transient pass without tripping the wrong device.
Upstream and Downstream Coordination
Selective coordination means the upstream device’s curve sits above and to the right of the downstream curve, with a clear margin at every current level. When curves overlap, both breakers sense the same fault and both open, converting a branch fault into a shelf-wide outage.
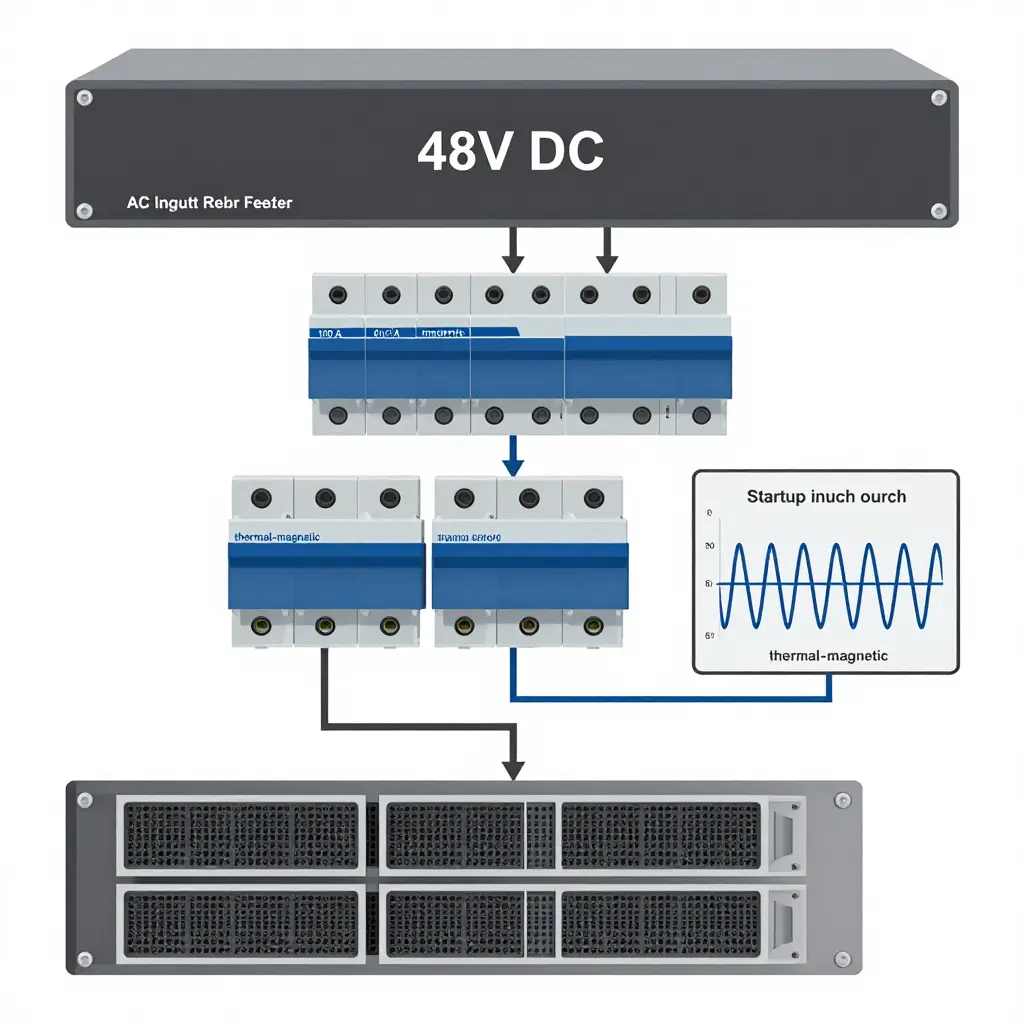
In a 48V DC hierarchy, the usual arrangement runs from a 100 A feeder breaker down to 20 A branch breakers at the load. The feeder’s instantaneous setting must be high enough that a branch fault is cleared downstream first.
A Practical Review Checklist
A coordination review checks three things: the measured inrush envelope, the instantaneous settings on each device, and the vertical gap between adjacent TCC curves. Adjust the downstream device first, since it owns the smallest trip window. This is the same uptime discipline behind routine fleet maintenance planning, where small, scheduled adjustments head off large, unscheduled outages.
https://take5-carwash.com/wp-content/uploads/2026/09/img-48v-dc-power-shelf-nuisance-trips-inrush-current-b-1.webp
The Fix Order That Actually Matters
Nuisance trips on a 48V DC power shelf are a sequence problem, not a bad-part problem. The order below follows how inrush current, protection devices, and thermal behavior actually interact, and it keeps the work tied to measured data instead of guesses.
-
Characterize the inrush profile. Capture the real current waveform at module bring-up with a current probe and an oscilloscope. Record peak amplitude, rise time, and I²t. Every later setpoint gets judged against this baseline; without it, you are guessing.
-
Verify terminations and torque. Loose or under-torqued lugs add resistance that distorts the fault path and can mimic a trip. Check every breaker, busbar, and module terminal against the manufacturer’s torque specification and confirm the hardware is seated. High-resistance joints also create localized heating that makes the thermal problem worse.
-
Confirm device ratings and temperature derating. Compare each breaker’s or fuse’s continuous rating against the ambient temperature inside the shelf, then apply the derating curve. A device rated for its nameplate current may carry far less at 55°C. Undersized or un-derated devices trip on normal load rather than on faults.
-
Adjust or re-coordinate trip settings. Only after the inrush profile and derated ratings are known can breaker coordination be tuned. Set instantaneous and short-time thresholds so upstream and downstream devices separate correctly under fault while tolerating the measured inrush envelope. This is the step most often rushed.
-
Add soft-start or limiting elements. If the inrush peak exceeds what the protection can tolerate, insert NTC thermistors, pre-charge resistors, or active soft-start circuits to shape the ramp. These reduce the inrush envelope instead of weakening protection.
-
Re-verify under worst-case simultaneous module bring-up. Test with every module energizing at once, at the highest expected ambient temperature. Sequential single-module tests hide the compounding effect of simultaneous inrush.
Why changing settings before measuring leads to repeat failures
Adjust trip settings before the inrush profile is measured and you are tuning against a guess. A raised threshold may survive one bring-up, then trip once ambient temperature climbs or modules energize together. The protection is now weaker, the root cause is untouched, and the trip returns on the next cold start. Each round of blind adjustment erodes margin and pushes the system closer to a real fault the protection can no longer clear.
A complete nuisance trip diagnosis starts with data, not with a screwdriver. Measure first, verify second, and only then change settings or hardware. Done in that order, the fix holds under the conditions that originally triggered the trip.
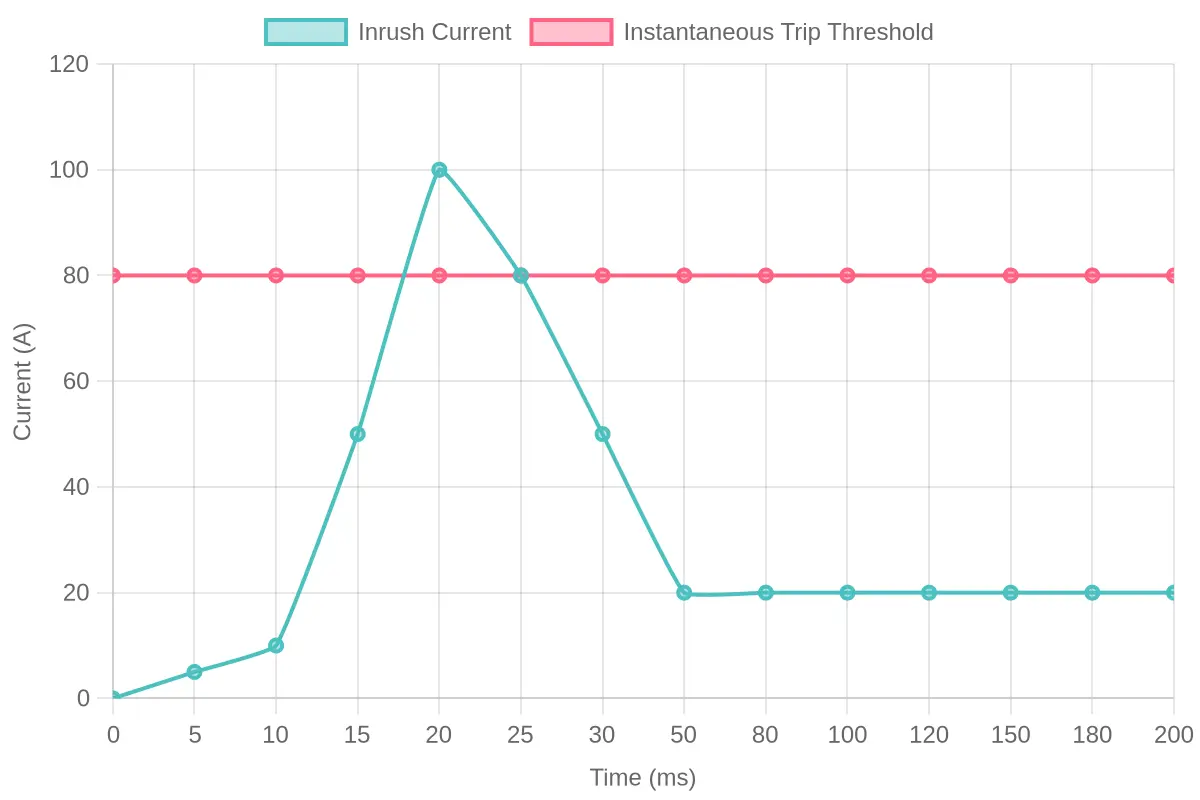
Most engineers sketch the same thing on a whiteboard the moment a 48V DC shelf starts nuisance-tripping: the inrush pulse against the breaker’s instantaneous threshold.
Reading the Coordination Window
The chart plots time (ms) on the x-axis against current (A) on the y-axis, with two traces:
- Inrush Current rises almost vertically as the shelf’s input capacitors charge, peaks at roughly 100 A in the first 10-15 ms, then decays exponentially toward a steady-state near 20 A.
- Instantaneous Trip Threshold sits flat at about 80 A across the full window.
Where the two lines cross is the whole story. The inrush pulse goes above the threshold only briefly (roughly 8-25 ms) and then drops below it as the capacitors fill. That narrow gap is your coordination window: if the breaker’s magnetic trip senses the spike before the decay resolves, it opens and you get a nuisance trip. If the response timing is coordinated, the transient passes and the shelf rides through.
This is why the fix order matters. Before you swap breakers or upsize feeders, confirm whether the trip is a true overcurrent event or a timing mismatch. The curve above usually settles the argument.
Fix-Order Priority Matrix
Treat this as your field checklist and work top to bottom. Each step de-risks the next, so jumping ahead usually wastes time and money. It is the same operational care that keeps uptime high at a high-traffic car wash site: measure first, adjust second, verify last.
| Fix Step | What It Addresses | Effort Level | Risk If Skipped | Expected Effect on Nuisance Trips |
|---|---|---|---|---|
| Measure inrush | True peak current draw per shelf | Low | Blind fixes; wrong breaker sizing | Sets the baseline; exposes the real culprit |
| Verify terminations | Loose lugs and high-resistance joints | Low | Arcing, heating, false trips under load | Clears intermittent voltage-sag trips |
| Confirm ratings | Breaker and PSU trip curves vs actual load | Low | Mismatched devices, chronic tripping | Reveals the coordination gap before tuning |
| Re-coordinate settings | Breaker-to-PSU curve alignment | Medium | Repeat trips at every startup | Sharply cuts startup nuisance trips |
| Add limiting | Inrush magnitude at energization | Medium-High | Persistent inrush trips despite tuning | Directly caps the inrush spike |
| Re-verify worst case | Full-load and cold-start scenario | Low | Regressions go undetected | Confirms the fix holds; prevents recurrence |
Work the rows in order; each fix earns its place before the next one starts.
Verifying the Fix and Trending for Recurrence
Once the coordination changes are in place, verification needs a repeatable sequence, not a single visual inspection. The goal is twofold: prove the nuisance trip is gone, and leave a baseline that will expose creeping degradation before it returns.
Controlled bring-up and waveform capture
Restore the shelf in stages instead of energizing everything at once. Bring up one rectifier module, confirm stability, then add modules in the intended startup order. Repeat the cold-start procedure several times, because inrush behavior on a cold start differs from a warm restart. With a current probe and an oscilloscope, capture each module’s inrush waveform and compare its peak amplitude and duration against the breaker’s instantaneous trip threshold. Capture the same waveform before and after the fix so the improvement is documented rather than assumed.
Logging trip events and trending temperature
Record every trip with a timestamp, the load condition, which breaker opened, and the ambient conditions at the time. Over several weeks, plot ambient temperature against trip frequency. Trips that cluster on hot afternoons and disappear overnight point to a thin thermal margin rather than a random fault. The chart below shows how a thermal trend can expose the relationship between rising ambient temperature and nuisance trip activity.
Maintenance log and creeping degradation
For each service visit, record the breaker part number, trip setting, measured inrush peak, ambient temperature, and any adjustments made. Degradation shows up as slow drift: a rising inrush peak, a breaker that trips at progressively lower currents, a widening gap between measured and rated values. One extra trip is minor. A repeating upward trend in the same direction is the signal to re-evaluate coordination.
Verification checklist
- Perform at least three controlled cold-start bring-ups in the intended startup order.
- Capture inrush waveform peak (A) and duration (ms) per module, before and after the fix.
- Confirm peak inrush stays below the breaker’s trip threshold with margin.
- Log each trip with timestamp, load, breaker, and ambient temperature.
- Trend ambient temperature against trip frequency over several weeks.
- Record breaker settings, inrush peaks, and adjustments in the maintenance log.
- Watch for rising inrush or lowering trip points as signs of creeping degradation.
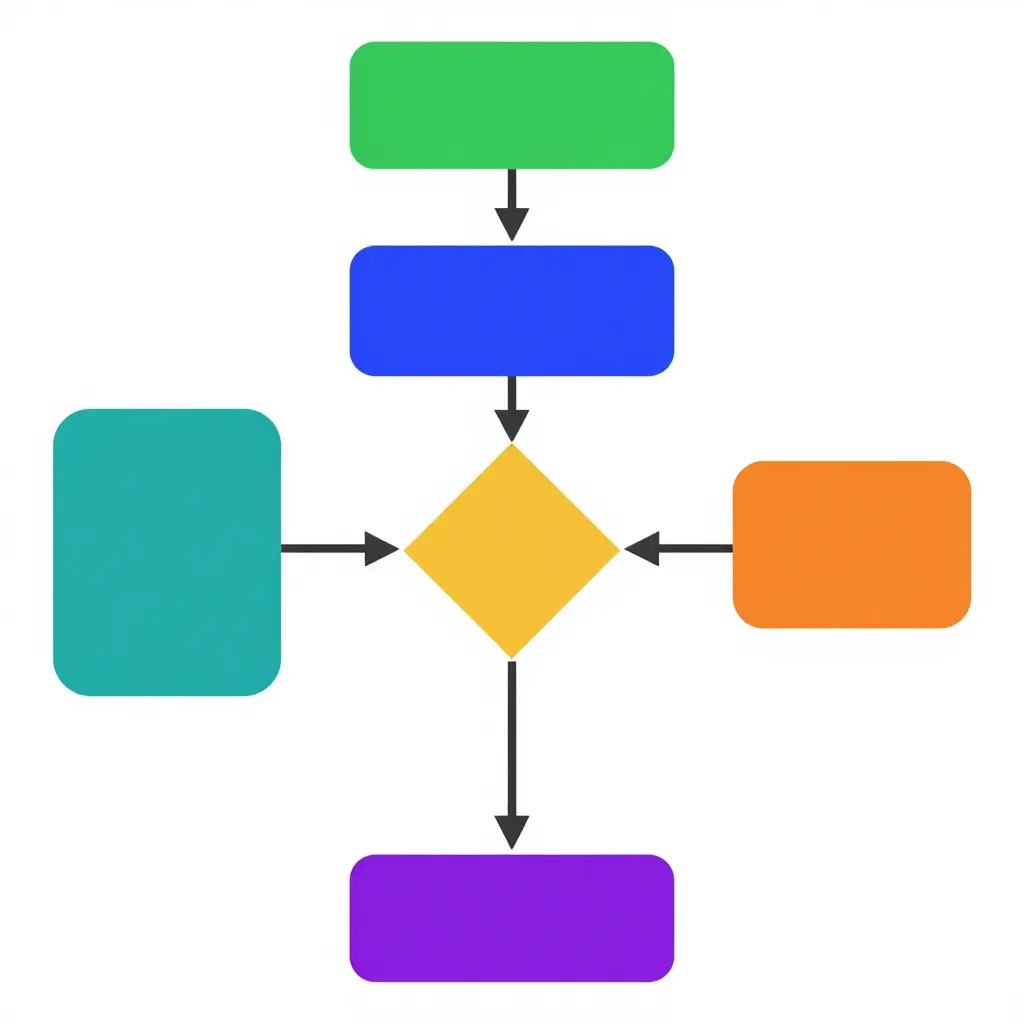
The diagram above traces the recommended fix order for nuisance trips, moving from the start node through a measurement step, into a branching decision, and out to two parallel remedies, coordination adjustment and hardware change, before both paths converge on a final re-verification stage.
Key Takeaways for Reliable 48V DC Power Shelves
Troubleshooting 48V DC power shelves gets far easier once you see the problem as a chain rather than a single fault. It starts with inrush current: when several rectifiers, fans, or downstream loads energize at once, the initial surge can momentarily exceed what a protective device expects. That surge feeds straight into coordination trouble, because a breaker sized for steady-state load may read a normal inrush event as a genuine fault and trip. Add mismatched curves, shared upstream feeds, or tightly timed power-up sequences, and you get nuisance trips that look random but are entirely predictable.
That is why order matters. Chasing symptoms out of sequence, swapping breakers before measuring inrush or adjusting trip settings before sequencing loads, usually moves the problem around instead of solving it. Follow the chain and each step builds on a verified baseline.
- Measure before you modify. Capture actual inrush waveforms before touching breaker settings.
- Fix coordination, not just sensitivity. Confirm device curves are properly graded so the surge is tolerated while true faults are still cleared.
- Stage your power-up. Sequence loads and stagger rectifier startups to keep combined inrush within design limits.
- Verify under real conditions. Re-test with the full load profile, not just a bench setup.
Moving Beyond the Quick Fix
The real win is proactive maintenance. Scheduled inrush audits, periodic coordination reviews, and post-change verification turn nuisance trips into a known, manageable variable instead of a recurring outage risk. Treat reliability as an ongoing practice and the shelves stop surprising you.
Related Resources
For teams thinking about operational reliability more broadly: franchise operational insights and self-service equipment reliability lessons.